Fiches d’information sur les circonscriptions fédérales
-
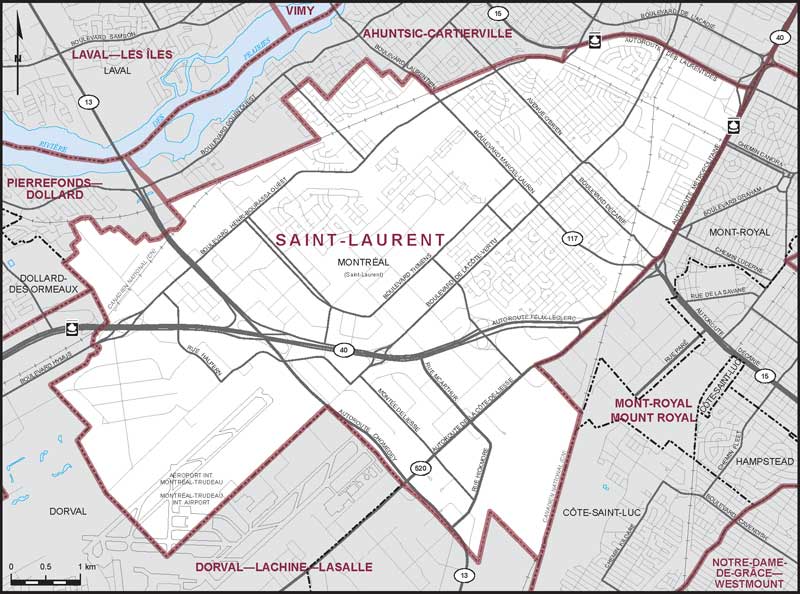
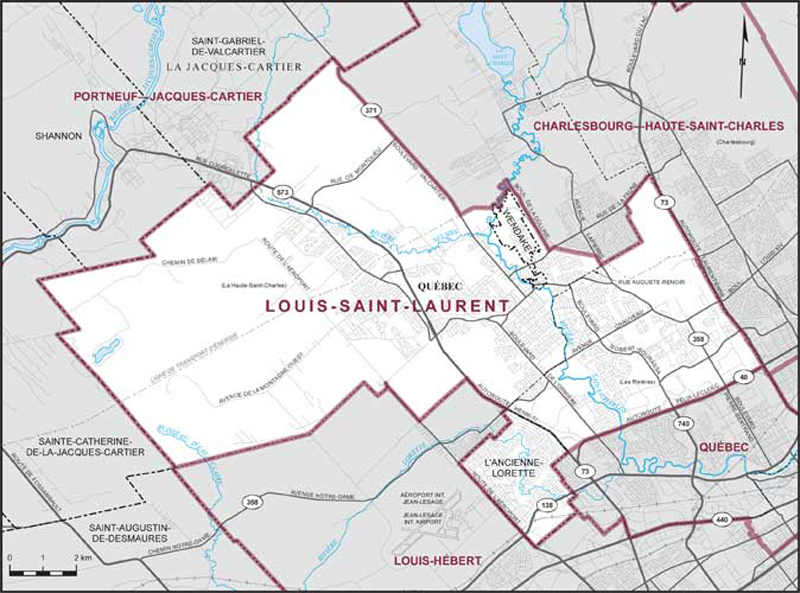
Electoral District :
Saint-LaurentProvince/Territory :
Québec-
Population :
108 763 -
Area :
44 km² -
Population density :
2 472,00/km² -
Population change :
s.o. -
Average age :
40 -
Average income :
49 760 $ -
Voter turnout :
60 %
Langue parlée le plus souvent à la maison :
-
English :
25 365 -
French :
32 930 -
Indigenous language :
5 -
Autre langue parlée le plus souvent :
-
Arabe :
11 390
-
-
All others :
24 225
-
-
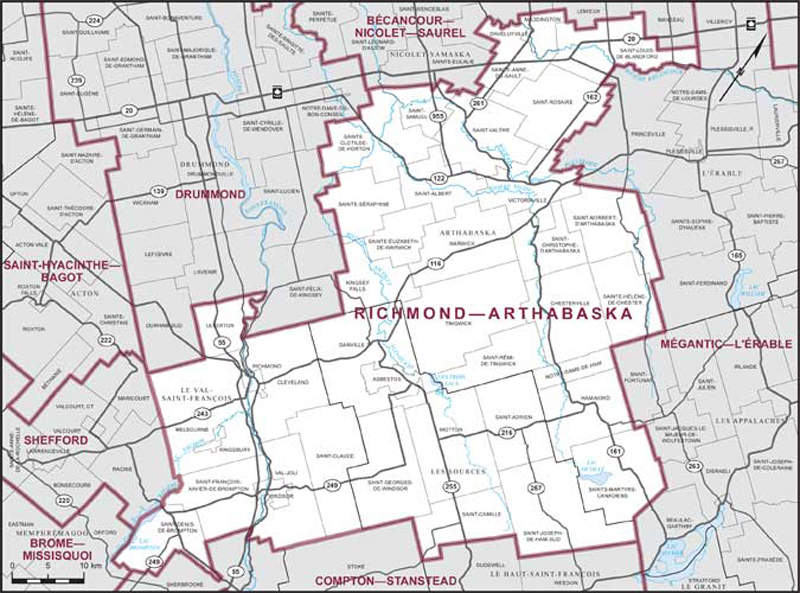
Electoral District :
Richmond—ArthabaskaProvince/Territory :
Québec-
Population :
110 651 -
Area :
3 427 km² -
Population density :
32,00/km² -
Population change :
s.o. -
Average age :
45 -
Average income :
44 920 $ -
Voter turnout :
70 %
Langue parlée le plus souvent à la maison :
-
English :
2 625 -
French :
104 035 -
Indigenous language :
0 -
Autre langue parlée le plus souvent :
-
Espagnol :
625
-
-
All others :
590
-
-
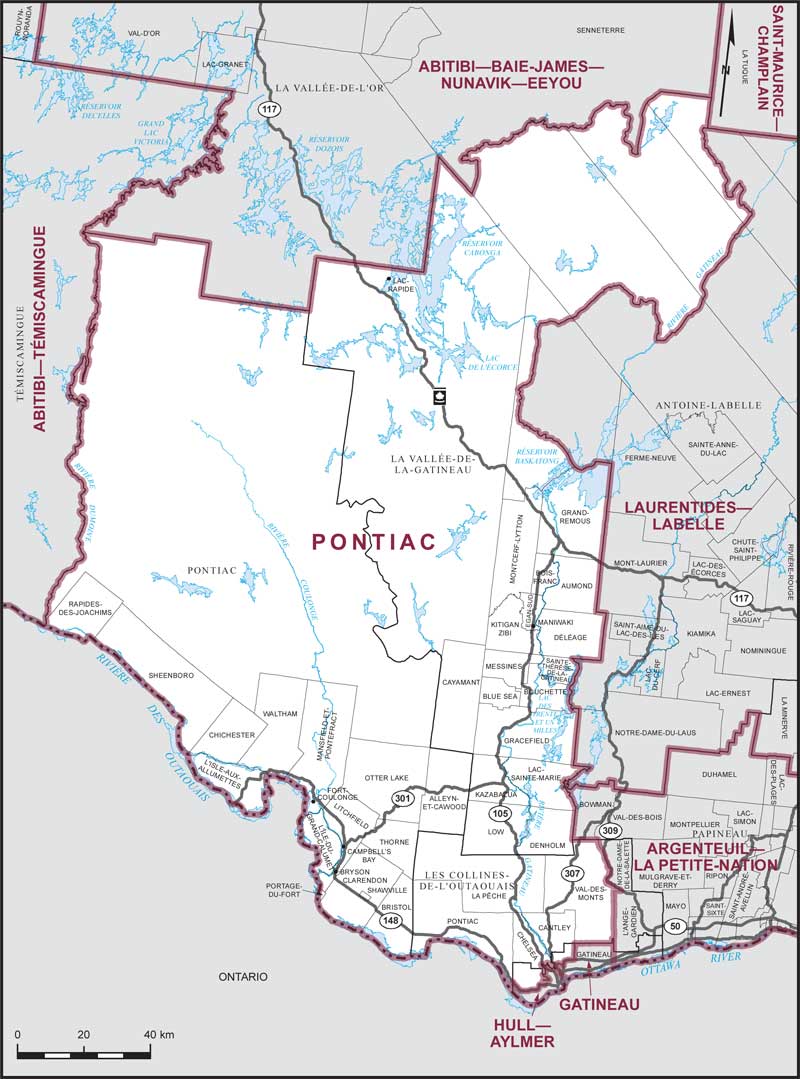
Electoral District :
Pontiac—Kitigan ZibiProvince/Territory :
Québec-
Population :
111 138 -
Area :
26 513 km² -
Population density :
4,00/km² -
Population change :
s.o. -
Average age :
40 -
Average income :
56 550 $ -
Voter turnout :
69 %
Langue parlée le plus souvent à la maison :
-
English :
34 020 -
French :
66 540 -
Indigenous language :
65 -
Autre langue parlée le plus souvent :
-
Arabe :
980
-
-
All others :
3 600
-
-
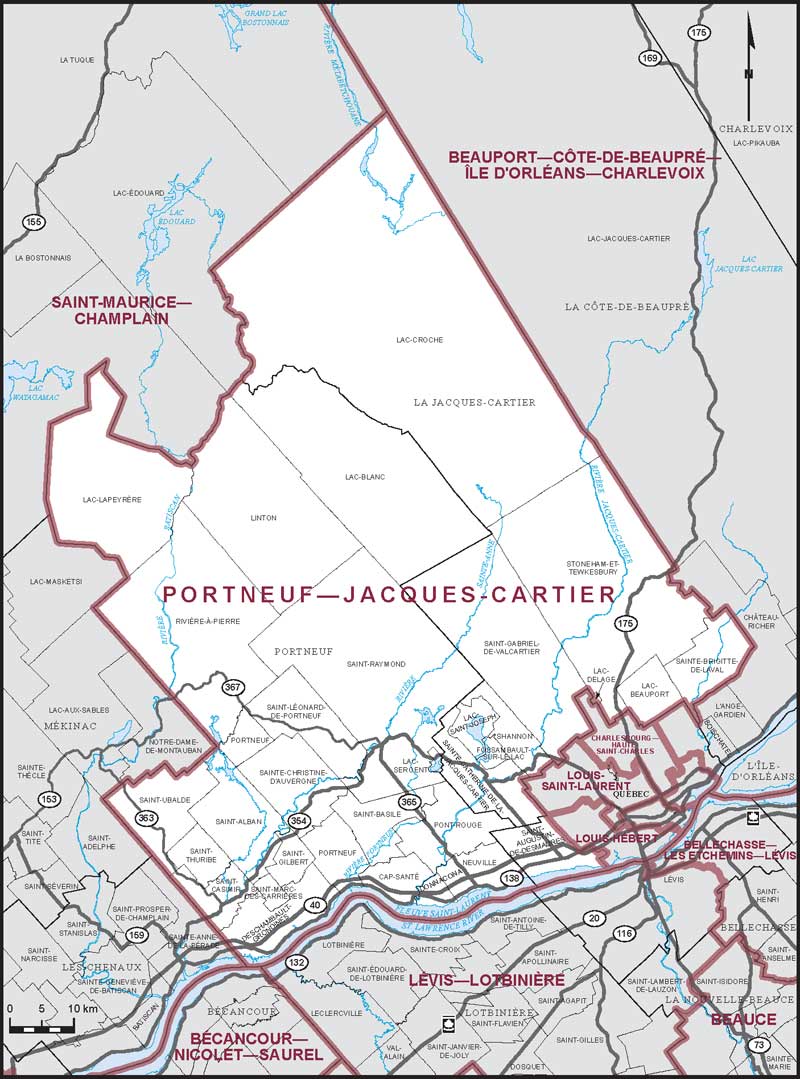
Electoral District :
Portneuf—Jacques-CartierProvince/Territory :
Québec-
Population :
106 611 -
Area :
6 987 km² -
Population density :
15,00/km² -
Population change :
s.o. -
Average age :
42 -
Average income :
55 650 $ -
Voter turnout :
74 %
Langue parlée le plus souvent à la maison :
-
English :
1 590 -
French :
102 550 -
Indigenous language :
0 -
Autre langue parlée le plus souvent :
-
Espagnol :
220
-
-
All others :
290
-
-
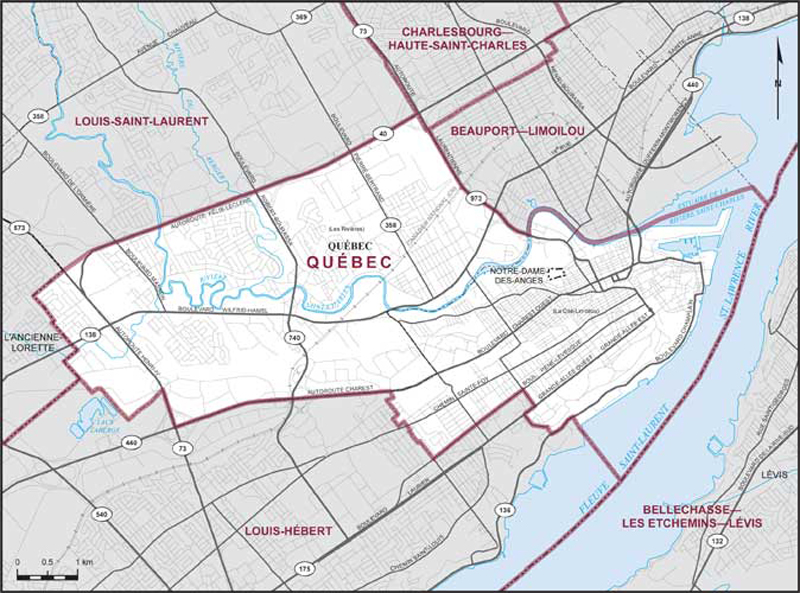
Electoral District :
Québec-CentreProvince/Territory :
Québec-
Population :
103 977 -
Area :
37 km² -
Population density :
2 810,00/km² -
Population change :
s.o. -
Average age :
46 -
Average income :
50 960 $ -
Voter turnout :
70 %
Langue parlée le plus souvent à la maison :
-
English :
1 915 -
French :
93 205 -
Indigenous language :
35 -
Autre langue parlée le plus souvent :
-
Espagnol :
1 210
-
-
All others :
2 695
-
-
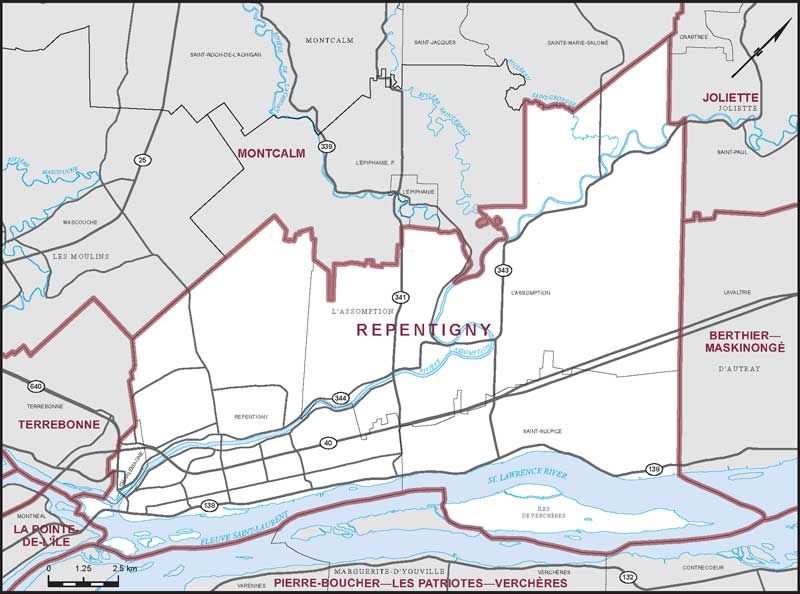
Electoral District :
RepentignyProvince/Territory :
Québec-
Population :
111 373 -
Area :
141 km² -
Population density :
790,00/km² -
Population change :
s.o. -
Average age :
43 -
Average income :
52 400 $ -
Voter turnout :
71 %
Langue parlée le plus souvent à la maison :
-
English :
1 930 -
French :
102 085 -
Indigenous language :
5 -
Autre langue parlée le plus souvent :
-
Espagnol :
1 220
-
-
All others :
2 425
-
-
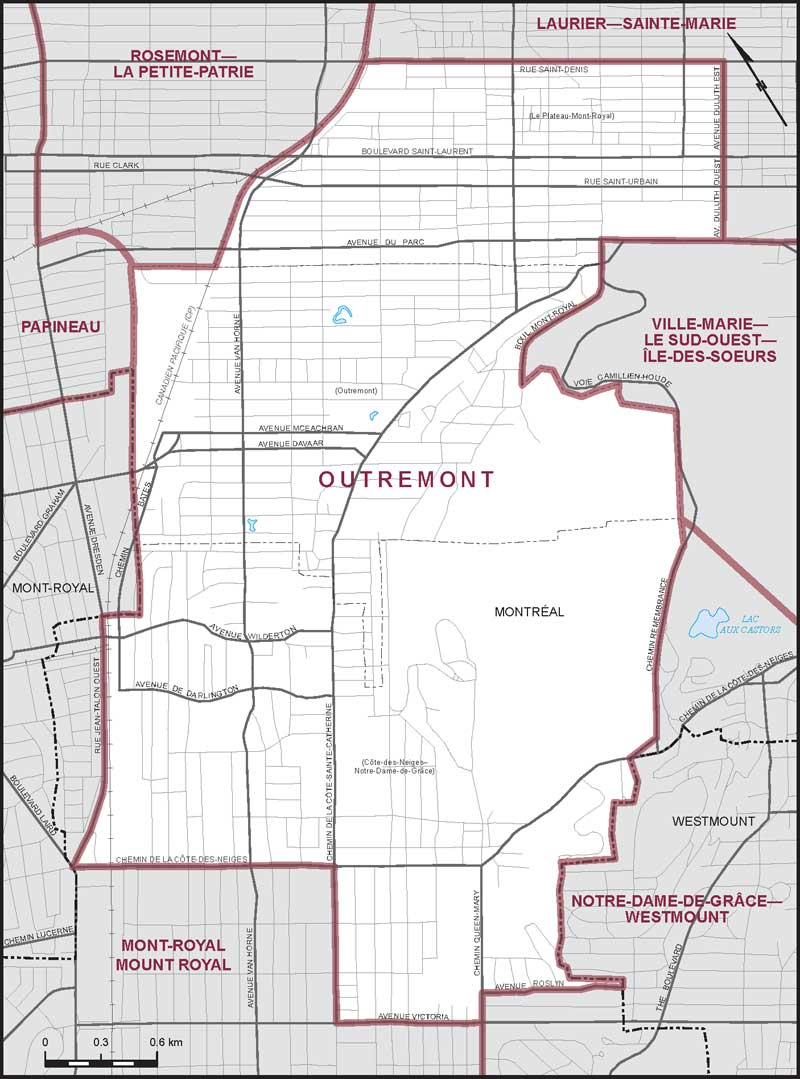
Electoral District :
OutremontProvince/Territory :
Québec-
Population :
115 051 -
Area :
13 km² -
Population density :
8 850,00/km² -
Population change :
s.o. -
Average age :
38 -
Average income :
60 000 $ -
Voter turnout :
62 %
Langue parlée le plus souvent à la maison :
-
English :
25 770 -
French :
57 125 -
Indigenous language :
20 -
Autre langue parlée le plus souvent :
-
Yiddish :
5 470
-
-
All others :
15 745
-
-
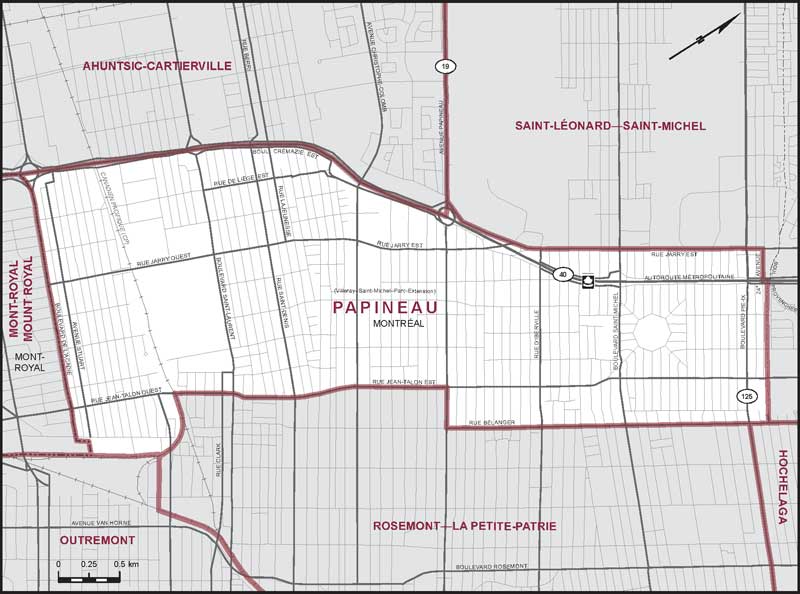
Electoral District :
PapineauProvince/Territory :
Québec-
Population :
110 813 -
Area :
10 km² -
Population density :
11 081,00/km² -
Population change :
s.o. -
Average age :
39 -
Average income :
43 160 $ -
Voter turnout :
66 %
Langue parlée le plus souvent à la maison :
-
English :
12 365 -
French :
58 770 -
Indigenous language :
10 -
Autre langue parlée le plus souvent :
-
Pendjabi (panjabi) :
4 880
-
-
All others :
23 870
-
-
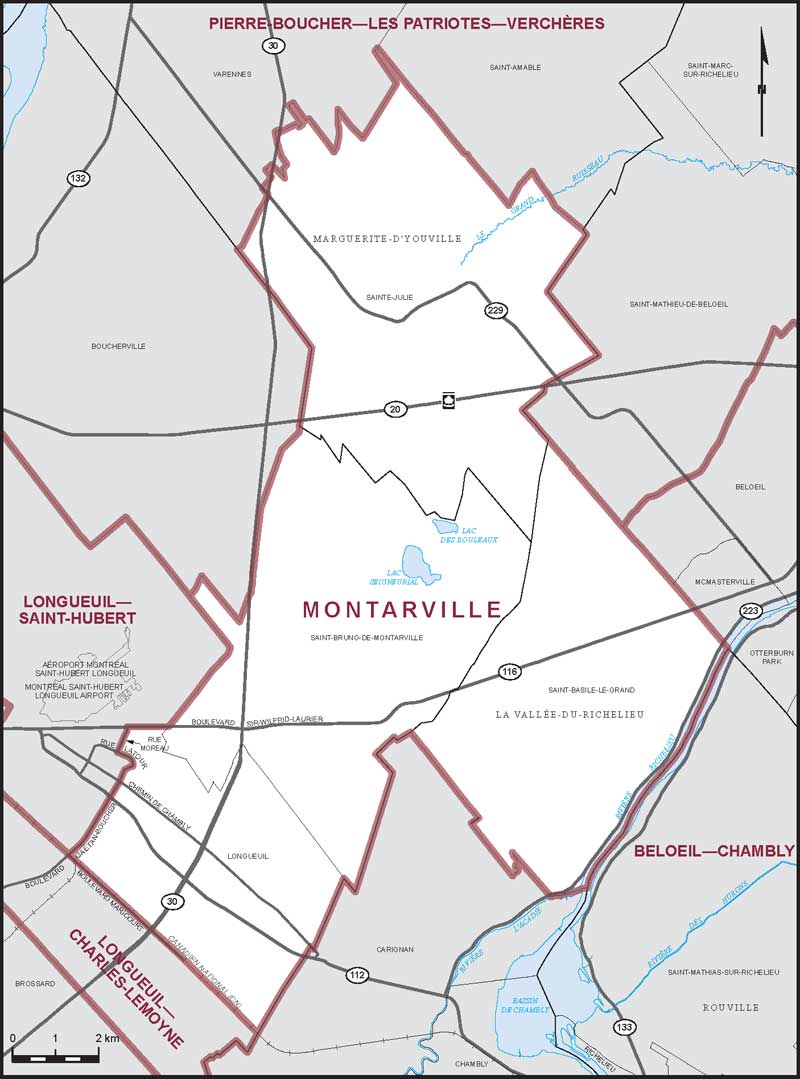
Electoral District :
Pierre-Boucher—Les Patriotes—VerchèresProvince/Territory :
Québec-
Population :
103 020 -
Area :
685 km² -
Population density :
150,00/km² -
Population change :
s.o. -
Average age :
42 -
Average income :
62 750 $ -
Voter turnout :
76 %
Langue parlée le plus souvent à la maison :
-
English :
2 055 -
French :
96 245 -
Indigenous language :
0 -
Autre langue parlée le plus souvent :
-
Espagnol :
745
-
-
All others :
1 375
-
-
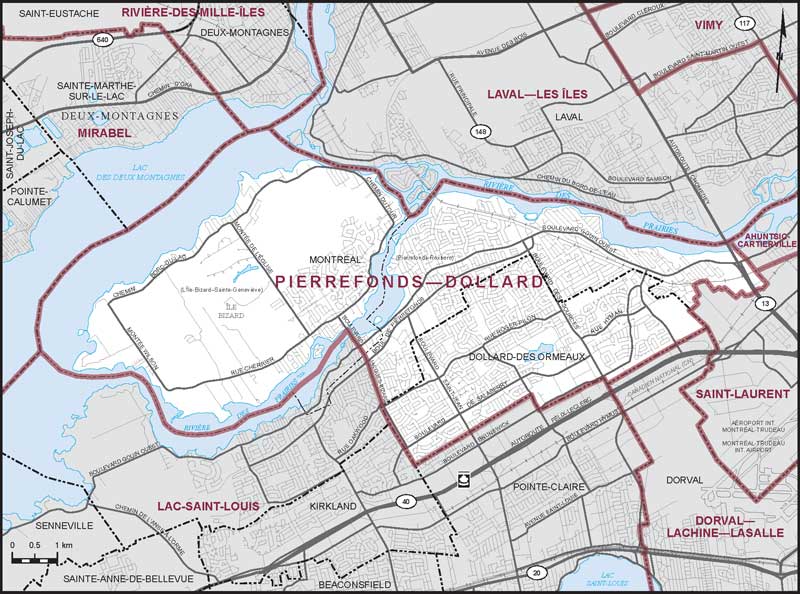
Electoral District :
Pierrefonds—DollardProvince/Territory :
Québec-
Population :
109 497 -
Area :
51 km² -
Population density :
2 147,00/km² -
Population change :
s.o. -
Average age :
42 -
Average income :
53 200 $ -
Voter turnout :
69 %
Langue parlée le plus souvent à la maison :
-
English :
48 465 -
French :
24 990 -
Indigenous language :
0 -
Autre langue parlée le plus souvent :
-
Arabe :
4 240
-
-
All others :
19 140
-
-
Electoral District :
Montmorency—CharlevoixProvince/Territory :
Québec-
Population :
101 119 -
Area :
11 282 km² -
Population density :
9,00/km² -
Population change :
s.o. -
Average age :
44 -
Average income :
53 800 $ -
Voter turnout :
72 %
Langue parlée le plus souvent à la maison :
-
English :
625 -
French :
97 905 -
Indigenous language :
0 -
Autre langue parlée le plus souvent :
-
Espagnol :
160
-
-
All others :
360
-
-
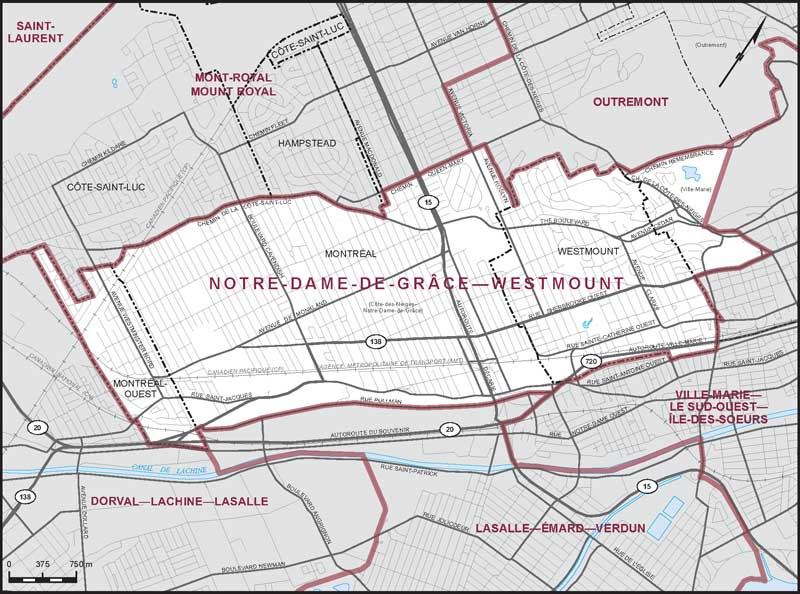
Electoral District :
Notre-Dame-de-Grâce—WestmountProvince/Territory :
Québec-
Population :
111 377 -
Area :
17 km² -
Population density :
6 552,00/km² -
Population change :
s.o. -
Average age :
42 -
Average income :
83 200 $ -
Voter turnout :
67 %
Langue parlée le plus souvent à la maison :
-
English :
55 300 -
French :
27 780 -
Indigenous language :
10 -
Autre langue parlée le plus souvent :
-
Mandarin :
2 520
-
-
All others :
15 405
-
-
Electoral District :
Mont-Saint-Bruno—L'AcadieProvince/Territory :
Québec-
Population :
111 323 -
Area :
205 km² -
Population density :
543,00/km² -
Population change :
s.o. -
Average age :
42 -
Average income :
64 300 $ -
Voter turnout :
78 %
Langue parlée le plus souvent à la maison :
-
English :
6 060 -
French :
95 260 -
Indigenous language :
0 -
Autre langue parlée le plus souvent :
-
Espagnol :
1 480
-
-
All others :
3 635
-
-
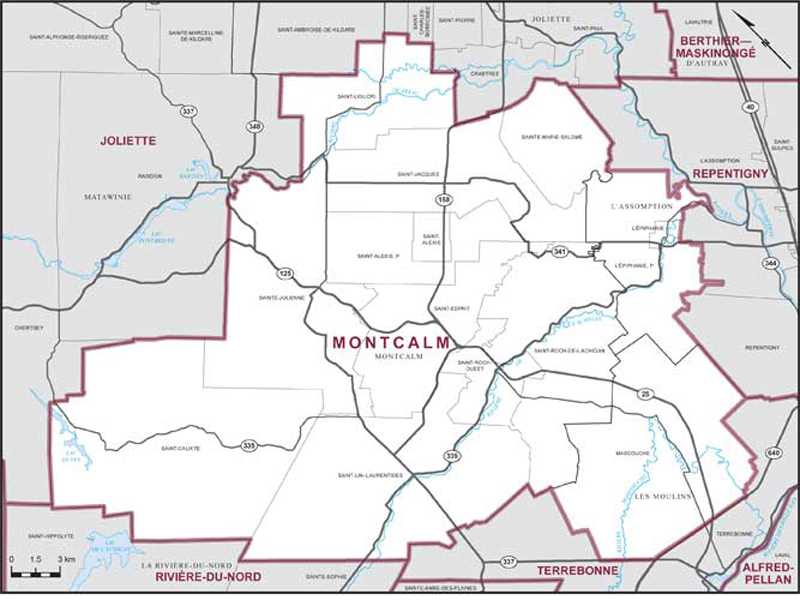
Electoral District :
MontcalmProvince/Territory :
Québec-
Population :
111 954 -
Area :
730 km² -
Population density :
153,00/km² -
Population change :
s.o. -
Average age :
40 -
Average income :
49 240 $ -
Voter turnout :
64 %
Langue parlée le plus souvent à la maison :
-
English :
1 925 -
French :
105 630 -
Indigenous language :
0 -
Autre langue parlée le plus souvent :
-
Espagnol :
645
-
-
All others :
945
-
-
Electoral District :
Marc-Aurèle-FortinProvince/Territory :
Québec-
Population :
104 636 -
Area :
53 km² -
Population density :
1 974,00/km² -
Population change :
s.o. -
Average age :
40 -
Average income :
55 050 $ -
Voter turnout :
70 %
Langue parlée le plus souvent à la maison :
-
English :
11 180 -
French :
71 270 -
Indigenous language :
5 -
Autre langue parlée le plus souvent :
-
Arabe :
3 570
-
-
All others :
9 735
-
-
Electoral District :
Mégantic—L'Érable—LotbinièreProvince/Territory :
Québec-
Population :
103 114 -
Area :
6 898 km² -
Population density :
15,00/km² -
Population change :
s.o. -
Average age :
47 -
Average income :
42 000 $ -
Voter turnout :
70 %
Langue parlée le plus souvent à la maison :
-
English :
825 -
French :
99 335 -
Indigenous language :
0 -
Autre langue parlée le plus souvent :
-
Espagnol :
550
-
-
All others :
375
-