Fiches d’information sur les circonscriptions fédérales
-
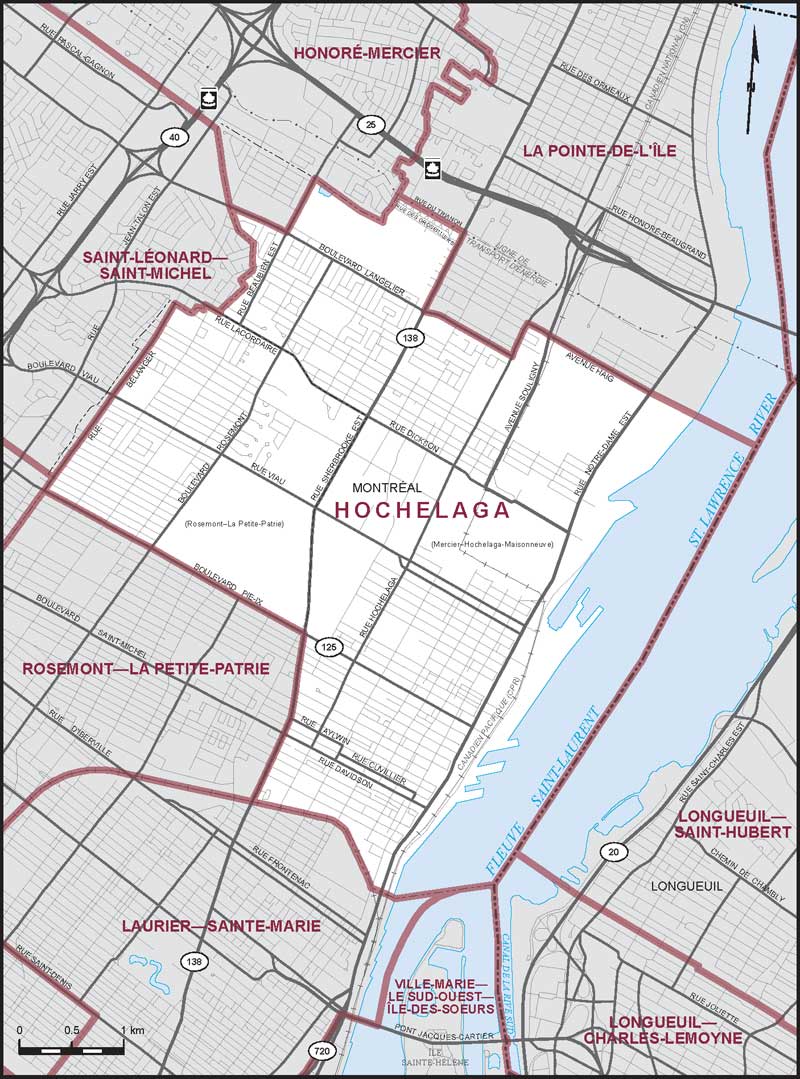
Electoral District :
Hochelaga—Rosemont-EstProvince/Territory :
Québec-
Population :
110 039 -
Area :
20 km² -
Population density :
5 502,00/km² -
Population change :
s.o. -
Average age :
41 -
Average income :
46 640 $ -
Voter turnout :
66 %
Langue parlée le plus souvent à la maison :
-
English :
6 995 -
French :
82 660 -
Indigenous language :
10 -
Autre langue parlée le plus souvent :
-
Espagnol :
3 030
-
-
All others :
8 845
-
-
Electoral District :
Honoré-MercierProvince/Territory :
Québec-
Population :
105 434 -
Area :
39 km² -
Population density :
2 703,00/km² -
Population change :
s.o. -
Average age :
43 -
Average income :
46 240 $ -
Voter turnout :
65 %
Langue parlée le plus souvent à la maison :
-
English :
19 750 -
French :
56 515 -
Indigenous language :
0 -
Autre langue parlée le plus souvent :
-
Italien :
3 995
-
-
All others :
13 835
-
-
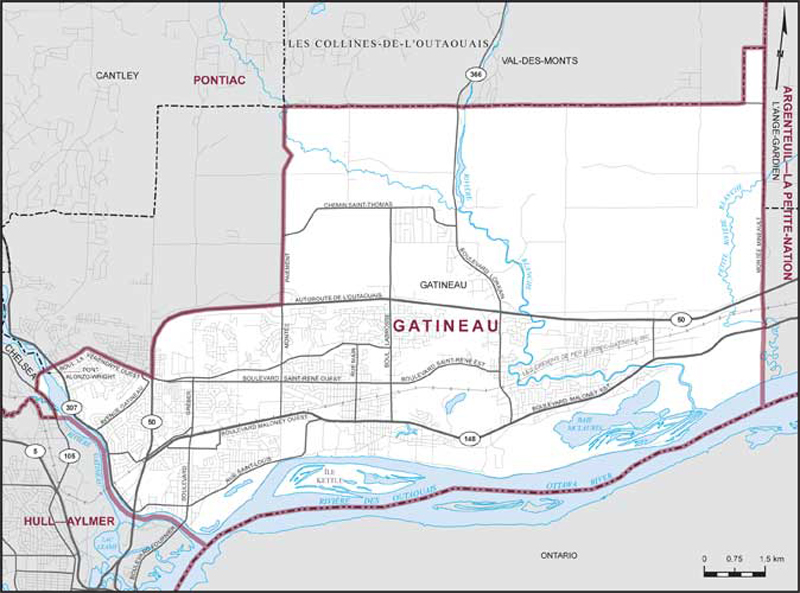
Electoral District :
Hull—AylmerProvince/Territory :
Québec-
Population :
105 559 -
Area :
61 km² -
Population density :
1 730,00/km² -
Population change :
s.o. -
Average age :
41 -
Average income :
54 450 $ -
Voter turnout :
69 %
Langue parlée le plus souvent à la maison :
-
English :
24 780 -
French :
62 220 -
Indigenous language :
20 -
Autre langue parlée le plus souvent :
-
Arabe :
1 830
-
-
All others :
6 670
-
-
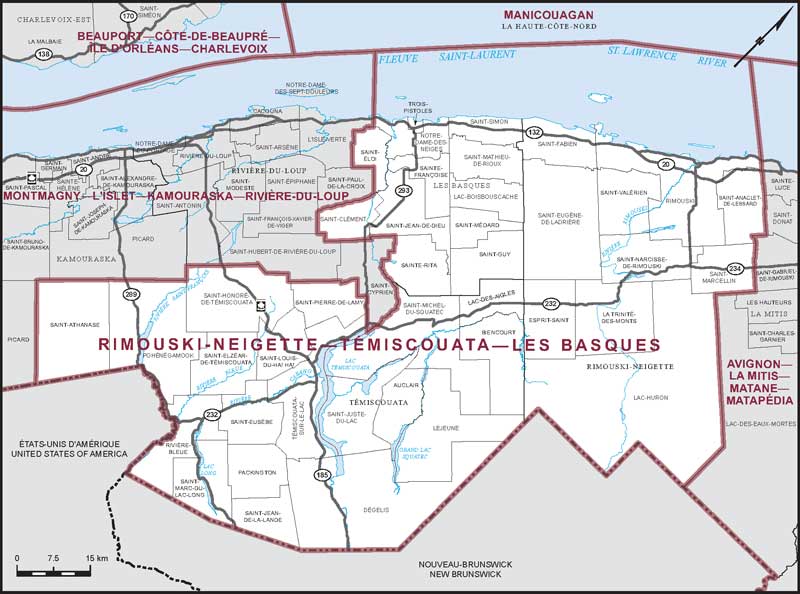
Electoral District :
Côte-du-Sud—Rivière-du-Loup—Kataskomiq—TémiscouataProvince/Territory :
Québec-
Population :
116 216 -
Area :
11 217 km² -
Population density :
10,00/km² -
Population change :
s.o. -
Average age :
47 -
Average income :
43 520 $ -
Voter turnout :
67 %
Langue parlée le plus souvent à la maison :
-
English :
440 -
French :
113 055 -
Indigenous language :
0 -
Autre langue parlée le plus souvent :
-
Espagnol :
250
-
-
All others :
235
-
-
Electoral District :
Compton—StansteadProvince/Territory :
Québec-
Population :
113 282 -
Area :
4 558 km² -
Population density :
25,00/km² -
Population change :
s.o. -
Average age :
42 -
Average income :
48 960 $ -
Voter turnout :
72 %
Langue parlée le plus souvent à la maison :
-
English :
11 775 -
French :
97 180 -
Indigenous language :
0 -
Autre langue parlée le plus souvent :
-
Espagnol :
710
-
-
All others :
775
-
-
Electoral District :
Chicoutimi—Le FjordProvince/Territory :
Québec-
Population :
92 460 -
Area :
3 591 km² -
Population density :
26,00/km² -
Population change :
s.o. -
Average age :
45 -
Average income :
48 480 $ -
Voter turnout :
69 %
Langue parlée le plus souvent à la maison :
-
English :
675 -
French :
90 170 -
Indigenous language :
55 -
Autre langue parlée le plus souvent :
-
Espagnol :
135
-
-
All others :
340
-
-
Electoral District :
Châteauguay—Les Jardins-de-NapiervilleProvince/Territory :
Québec-
Population :
114 947 -
Area :
1 460 km² -
Population density :
79,00/km² -
Population change :
s.o. -
Average age :
41 -
Average income :
48 400 $ -
Voter turnout :
69 %
Langue parlée le plus souvent à la maison :
-
English :
20 235 -
French :
83 980 -
Indigenous language :
5 -
Autre langue parlée le plus souvent :
-
Espagnol :
1 495
-
-
All others :
4 360
-
-
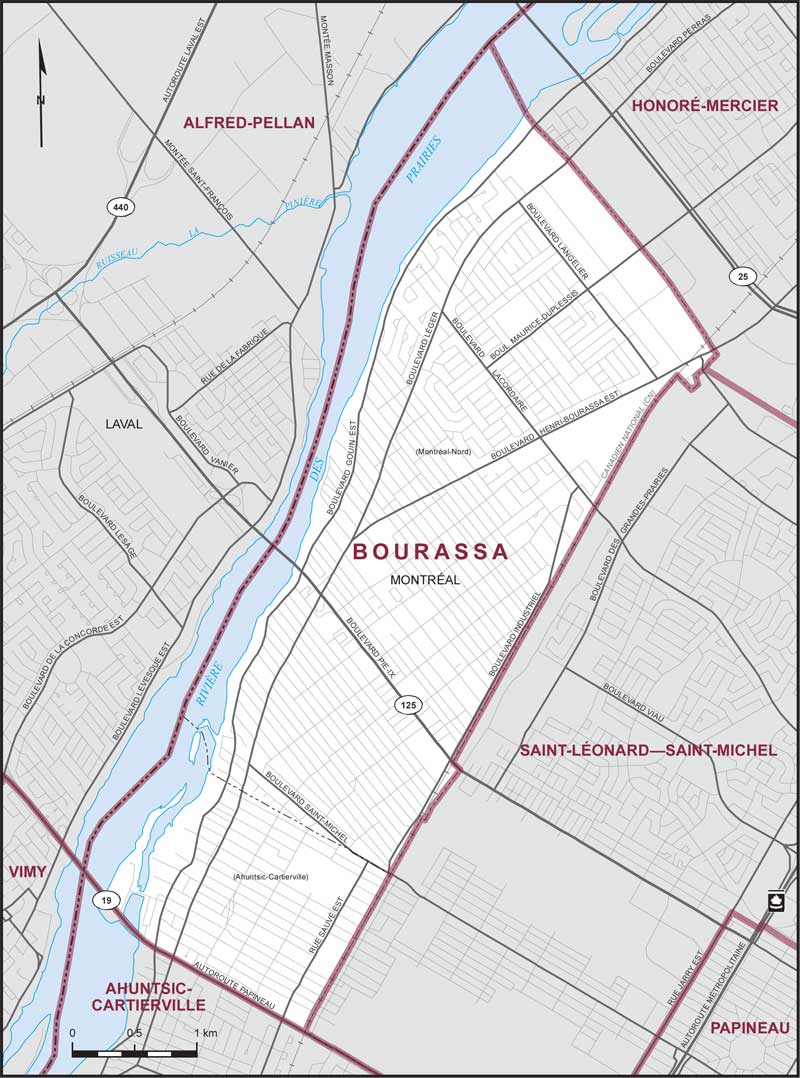
Electoral District :
BourassaProvince/Territory :
Québec-
Population :
105 637 -
Area :
14 km² -
Population density :
7 546,00/km² -
Population change :
s.o. -
Average age :
41 -
Average income :
38 960 $ -
Voter turnout :
57 %
Langue parlée le plus souvent à la maison :
-
English :
8 235 -
French :
62 265 -
Indigenous language :
0 -
Autre langue parlée le plus souvent :
-
Espagnol :
5 290
-
-
All others :
18 375
-
-
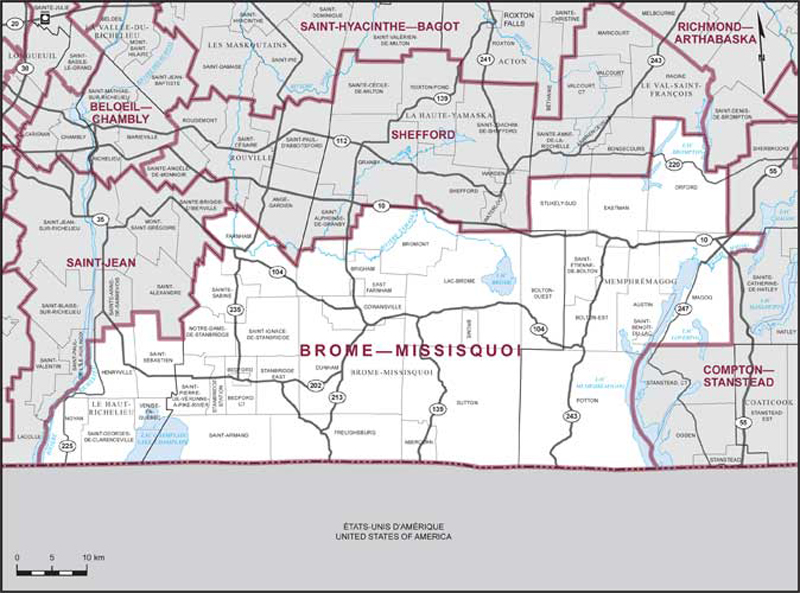
Electoral District :
Brome—MissisquoiProvince/Territory :
Québec-
Population :
113 913 -
Area :
2 779 km² -
Population density :
41,00/km² -
Population change :
s.o. -
Average age :
48 -
Average income :
52 800 $ -
Voter turnout :
72 %
Langue parlée le plus souvent à la maison :
-
English :
14 715 -
French :
93 990 -
Indigenous language :
0 -
Autre langue parlée le plus souvent :
-
Espagnol :
295
-
-
All others :
515
-
-
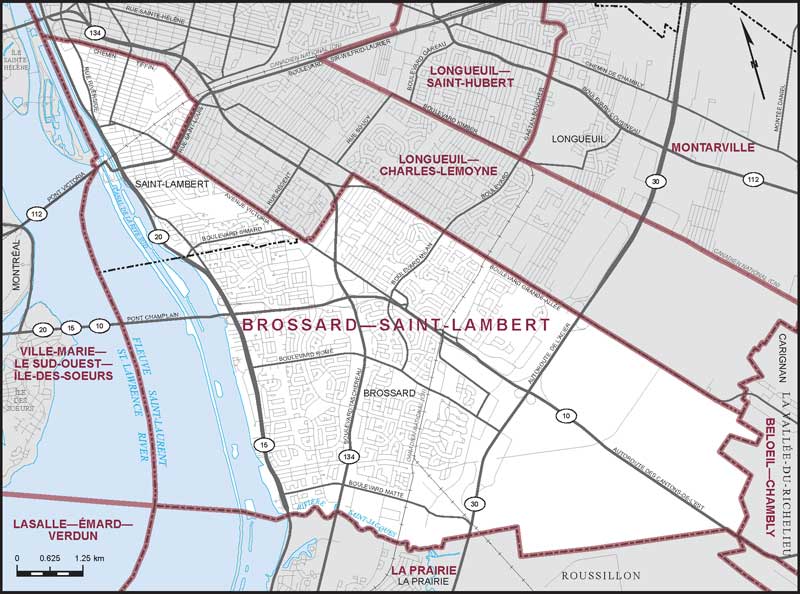
Electoral District :
Brossard—Saint-LambertProvince/Territory :
Québec-
Population :
114 286 -
Area :
53 km² -
Population density :
2 156,00/km² -
Population change :
s.o. -
Average age :
44 -
Average income :
60 200 $ -
Voter turnout :
68 %
Langue parlée le plus souvent à la maison :
-
English :
19 590 -
French :
55 415 -
Indigenous language :
0 -
Autre langue parlée le plus souvent :
-
Mandarin :
5 840
-
-
All others :
21 645
-
-
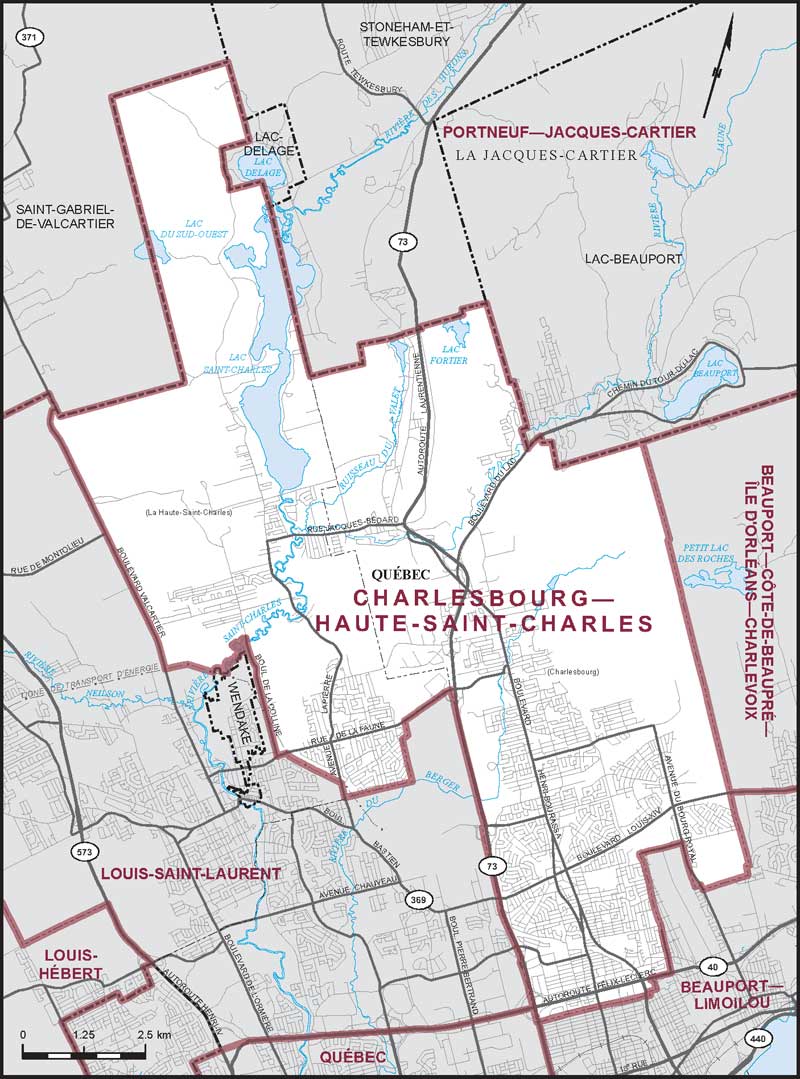
Electoral District :
Charlesbourg—Haute-Saint-CharlesProvince/Territory :
Québec-
Population :
113 308 -
Area :
118 km² -
Population density :
960,00/km² -
Population change :
s.o. -
Average age :
43 -
Average income :
51 500 $ -
Voter turnout :
73 %
Langue parlée le plus souvent à la maison :
-
English :
925 -
French :
107 565 -
Indigenous language :
30 -
Autre langue parlée le plus souvent :
-
Espagnol :
670
-
-
All others :
1 485
-
-
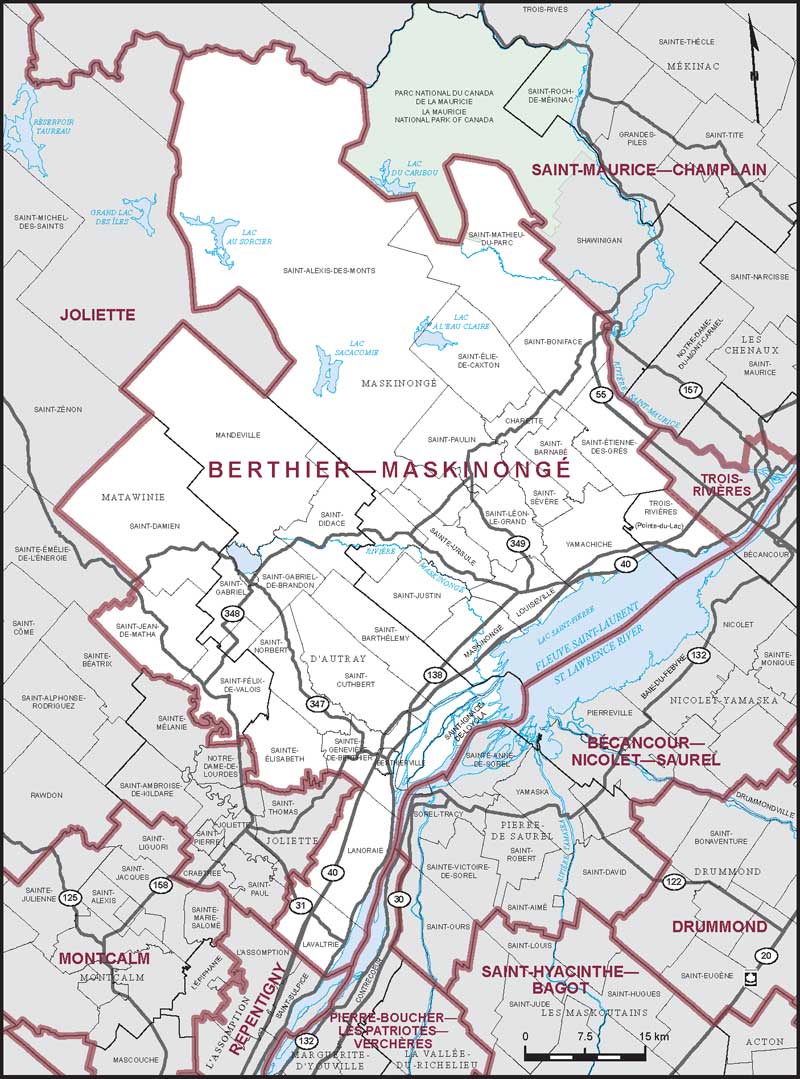
Electoral District :
Berthier—MaskinongéProvince/Territory :
Québec-
Population :
108 640 -
Area :
4 151 km² -
Population density :
26,00/km² -
Population change :
s.o. -
Average age :
46 -
Average income :
44 520 $ -
Voter turnout :
68 %
Langue parlée le plus souvent à la maison :
-
English :
825 -
French :
105 350 -
Indigenous language :
0 -
Autre langue parlée le plus souvent :
-
Espagnol :
265
-
-
All others :
300
-
-
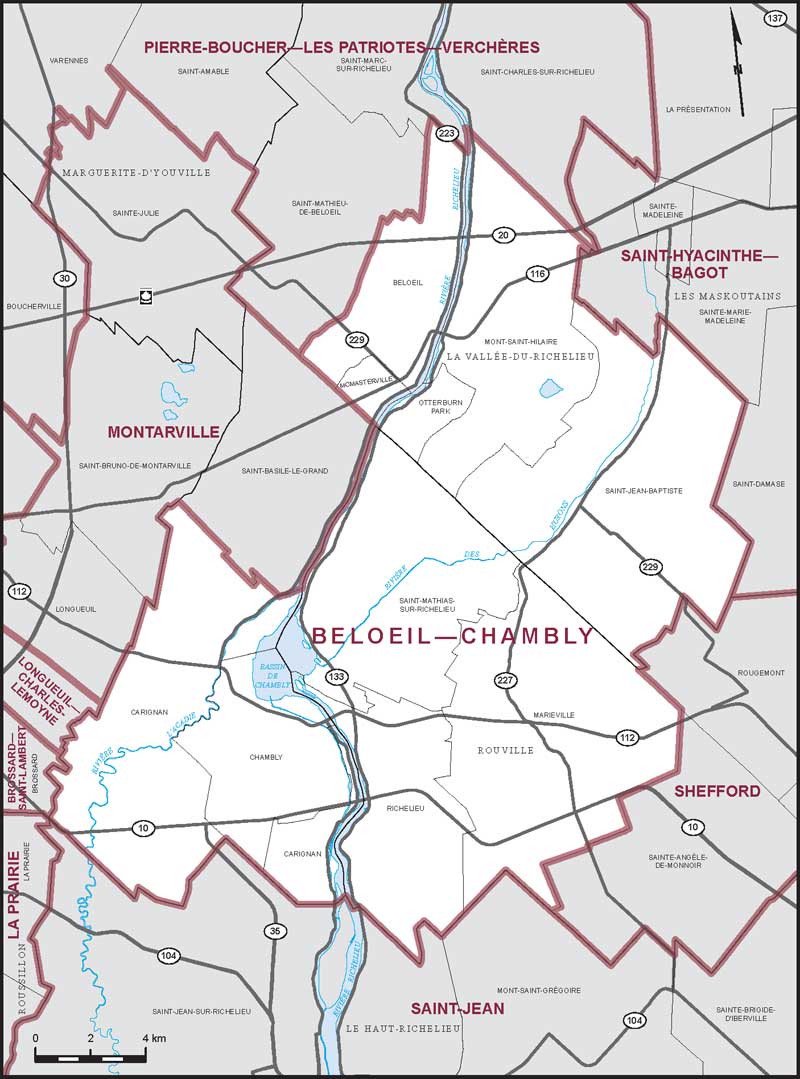
Electoral District :
Beloeil—ChamblyProvince/Territory :
Québec-
Population :
114 551 -
Area :
323 km² -
Population density :
355,00/km² -
Population change :
s.o. -
Average age :
42 -
Average income :
58 250 $ -
Voter turnout :
75 %
Langue parlée le plus souvent à la maison :
-
English :
3 820 -
French :
105 270 -
Indigenous language :
0 -
Autre langue parlée le plus souvent :
-
Espagnol :
700
-
-
All others :
1 395
-
-
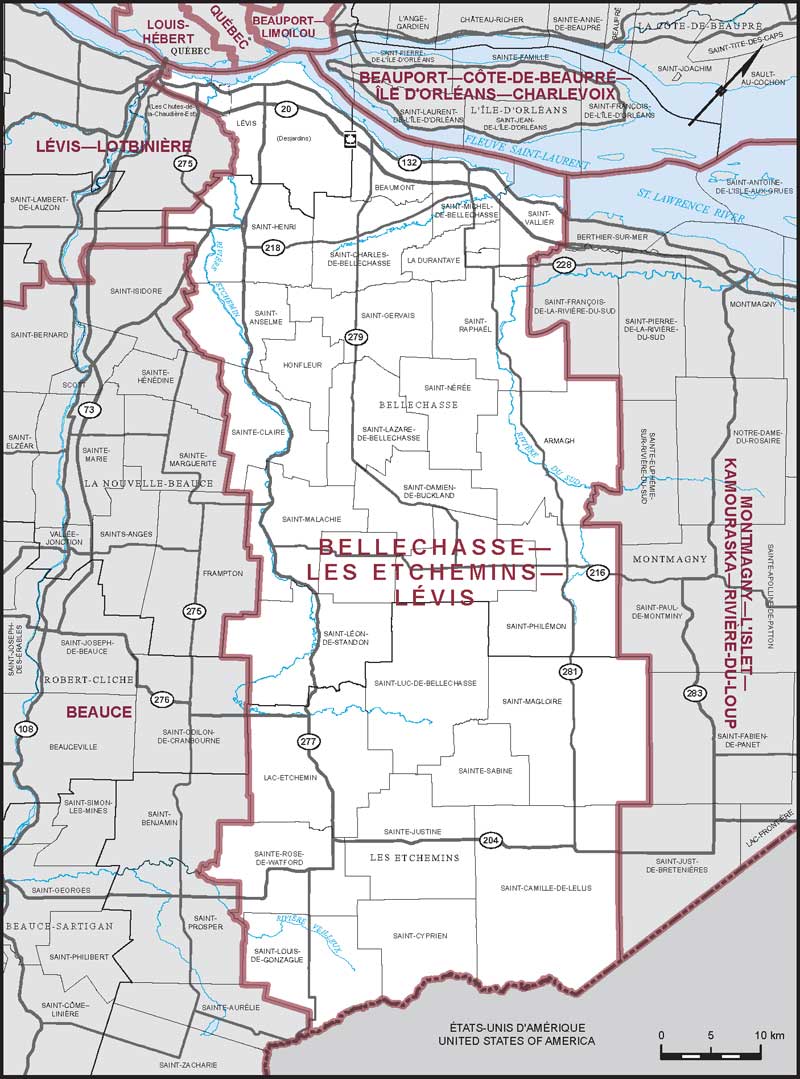
Electoral District :
Bellechasse—Les Etchemins—LévisProvince/Territory :
Québec-
Population :
111 737 -
Area :
3 192 km² -
Population density :
35,00/km² -
Population change :
s.o. -
Average age :
45 -
Average income :
48 960 $ -
Voter turnout :
72 %
Langue parlée le plus souvent à la maison :
-
English :
695 -
French :
107 190 -
Indigenous language :
0 -
Autre langue parlée le plus souvent :
-
Espagnol :
460
-
-
All others :
650
-
-
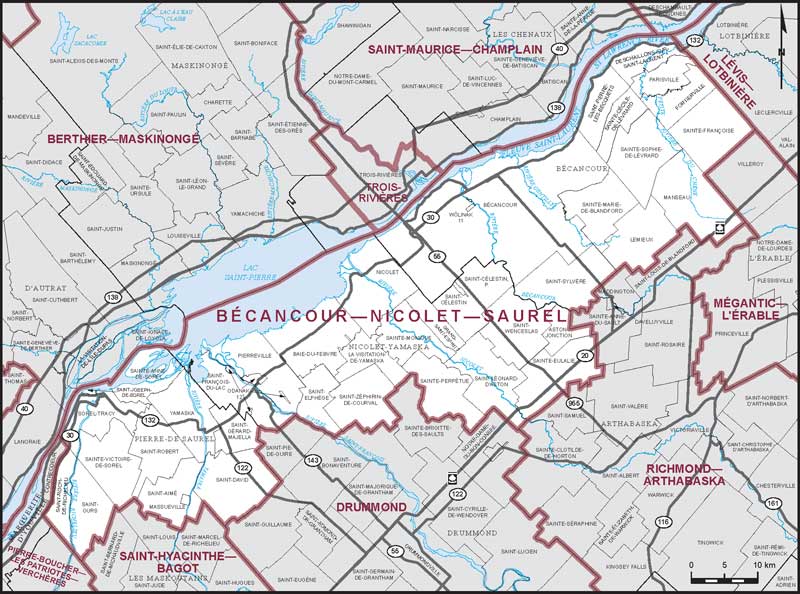
Electoral District :
Bécancour—Nicolet—Saurel—AlnôbakProvince/Territory :
Québec-
Population :
96 439 -
Area :
2 743 km² -
Population density :
35,00/km² -
Population change :
s.o. -
Average age :
47 -
Average income :
45 320 $ -
Voter turnout :
67 %
Langue parlée le plus souvent à la maison :
-
English :
645 -
French :
92 730 -
Indigenous language :
0 -
Autre langue parlée le plus souvent :
-
Espagnol :
230
-
-
All others :
345
-
-
Electoral District :
Beauharnois—Salaberry—Soulanges—HuntingdonProvince/Territory :
Québec-
Population :
118 474 -
Area :
1 663 km² -
Population density :
71,00/km² -
Population change :
s.o. -
Average age :
43 -
Average income :
46 640 $ -
Voter turnout :
67 %
Langue parlée le plus souvent à la maison :
-
English :
10 855 -
French :
102 545 -
Indigenous language :
10 -
Autre langue parlée le plus souvent :
-
Espagnol :
410
-
-
All others :
895
-